Spectrogram Generator
A spectrogram is a visual representation of the frequency content of a sound over time. Upload your audio file (WAV or MP3) below to generate its spectrogram.
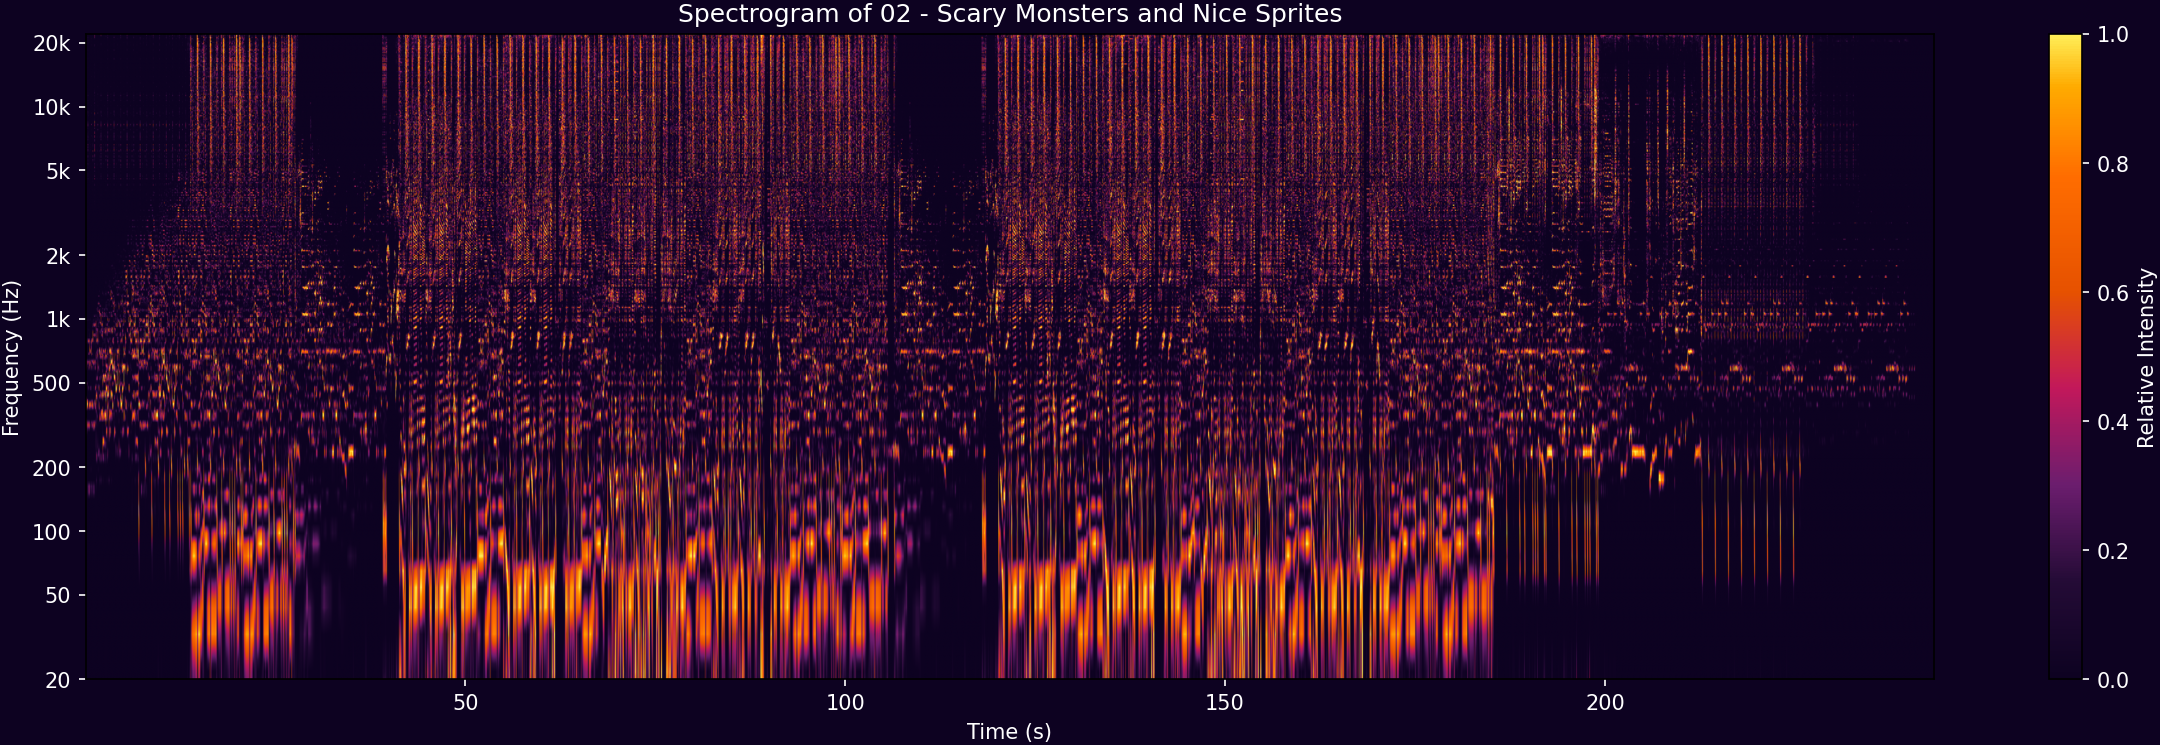
Click the spectrogram image to view it in a larger png.
The spectrogram displays time on the x-axis, frequency on the y-axis, and the intensity of the sound at each time/frequency point is represented by the color.
A spectrogram is a visual representation of the frequency content of a sound over time. It is a two-dimensional graph that displays the amplitude of sound waves at different frequencies at different times.
contact: skycoastalmusic at gmail
×
![]()